For example, are all your student scores in the class close to the average? Or are lots of scores way above (or way below) the average score?
Inferential Statistics

You have read two new terms in previous section; Z score and standard deviation and how these are used in inferential statistics. Now, let's look at each one of them in detail.
(1) Standard Deviation
Standard deviation is a measure of dispersement in statistics. “Dispersement” tells you how much your data is spread out. Specifically, it shows you how much your data is spread out around the mean or average.
The bell curve (what statisticians call a “normal distribution“) is commonly seen in statistics as a tool to understand standard deviation. Below is an example showing standard deviation on a graph.
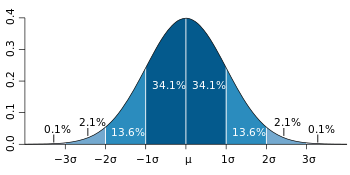
The above graph of a normal distribution represents a great deal of data in real life. The mean, or average, is represented by the Greek letter μ, in the center. Each segment (colored in dark blue to light blue) represents one standard deviation away from the mean. For example, 2σ means two standard deviations from the mean.
(2) Z-Score
Z-score (also called a standard score) gives you an idea of how far from the mean a data point is.
A z-score can be placed on a normal distribution curve. Z-scores range from -3 standard deviations (which would fall to the far left of the normal distribution curve) up to +3 standard deviations (which would fall to the far right of the normal distribution curve). If a z-score is equal to 0, it is on the mean.

In order to use a z-score, you need to know the mean μ and also the population standard deviation σ.

- A positive z-score indicates the raw score is higher than the mean average. For example, if a z-score is equal to +1, it is 1 standard deviation above the mean.
- A negative z-score reveals the raw score is below the mean average. For example, if a z-score is equal to -2, it is 2 standard deviations below the mean.
Null and Alternative Hypothesis
Null Hypothesis: A general statement that there is no relationship between two measured phenomena or no association among groups.
Alternative Hypothesis: Be contrary to the null hypothesis.
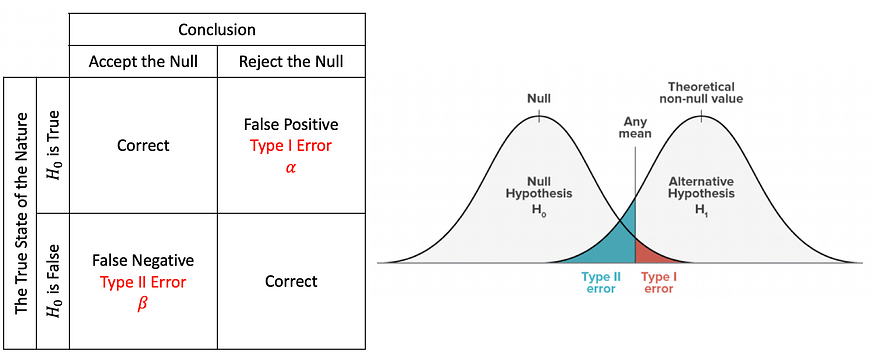
In statistical hypothesis testing, a type I error (false positive represented by α) is the rejection of a true null hypothesis, while a type II error (false negative represented by β) is the non-rejection of a false null hypothesis.
Interpretation
P-value: The probability of the test statistic being at least as extreme as the one observed given that the null hypothesis is true. When p-value > α, we fail to reject the null hypothesis, while p-value ≤ α, we reject the null hypothesis, and we can conclude that we have a significant result.
Critical Value: A point on the scale of the test statistic beyond which we reject the null hypothesis and is derived from the level of significance α of the test. It depends upon a test statistic, which is specific to the type of test, and the significance level, α, which defines the sensitivity of the test.
Significance Level and Rejection Region: The rejection region is actually dependent on the significance level. The significance level is denoted by α and is the probability of rejecting the null hypothesis if it is true.
Z-Test
A Z-test is any statistical test for which the distribution of the test statistic under the null hypothesis can be approximated by a normal distribution and tests the mean of a distribution in which we already know the population variance.
T-Test
A T-test is the statistical test if the population variance is unknown, and the sample size is not large (n < 30).
Paired sample means that we collect data twice from the same group, person, item, or thing.
Independent sample implies that the two samples must have come from two completely different populations.
ANOVA (Analysis of Variance)
ANOVA is the way to find out if experimental results are significant. One-way ANOVA compares two means from two independent groups using only one independent variable. Two-way ANOVA is the extension of one-way ANOVA using two independent variables to calculate the main effect and interaction effect.
Chi-Square Test
Chi-Square Test checks whether or not a model follows approximately normality when we have s discrete set of data points. Goodness of Fit Test determines if a sample matches the population fit one categorical variable to a distribution. Chi-Square Test for Independence compares two sets of data to see if there is a relationship.